The Quad Model
Most of what we know about people's attitudes comes from asking them. That works until it doesn't. Sometimes people are unwilling to say what they think, particularly about socially sensitive topics. Sometimes they are willing but unable, because the attitude isn't fully available to introspection. And sometimes they are simply not motivated to dig for an honest answer. Indirect methods were built to work around this: rather than asking people to report an attitude, they infer it from how people perform a task.
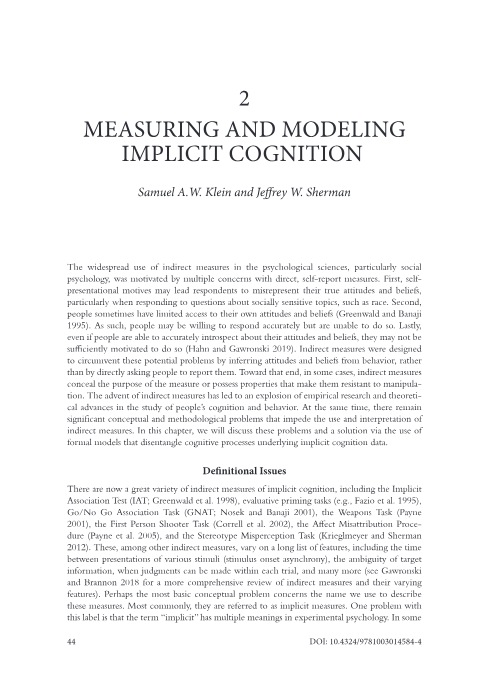
The Implicit Association Test
The most widely used indirect method is the Implicit Association Test (IAT). It is a sorting task: people see items representing two categories — faces, words, or names — one at a time and sort them using one of two keys. The catch is in how the keys are assigned: in one arrangement of the common race-based version, White faces and good words share a key; in another, Black faces and good words share it.
The task is meant to capture the difference in performance between these arrangements, on the assumption that a stronger association will show up as better performance under one arrangement than the other. Better performance when Black faces and good words share a key, for instance, is taken to suggest an association that favors responding to Black targets more positively; better performance when White faces and good words share a key suggests the reverse.
The difference in performance between the pairings is typically computed as the D-score: a single numeric summary of how much faster someone responded under one pairing than the other. Faster responding is taken to reflect a stronger preferential association toward one group, treating the difference as a measure of bias itself. Most of the literature on implicit intergroup bias relies on this metric.
What one number leaves out
The D-score is a singular, relative index. It suggests a person favored one group over the other, and by how much. That is genuinely useful, but it is also less information than what is offered by IAT data. Moreover, very different psychological processes may produce the same D-score.
Consider two ways a preference for one group over another could emerge. It could rest on more positive evaluations of the favored group or more negative evaluations of the other. These are not the same explanation, and a person could arrive at an identical score either way.
Now consider a second ambiguity. Evaluative associations (e.g., "Black = good") do not always influence behavior whenever they are activated. Regulatory processes such as suppression and inhibition can gate the expression of an evaluation before it reaches behavior. With that in mind, the same intergroup bias can arise from two very different psychological stories: the evaluation was rarely activated but also rarely regulated, or it was often activated but often regulated. The outcome is the same in both. What differs is how much the attitude itself is driving that outcome, making it risky to assume a one-to-one relationship between a single metric like the D-score and evaluations.
Neither ambiguity is a flaw in the IAT per se. It is a limitation in relying on a single metric for a process-level explanation of IAT performance, with two common misinterpretations. First, the discrimination and prejudice literatures routinely describe "anti-Black" or "anti-gay" bias for D-scores that may be as much or more about "pro-White" and "pro-straight" evaluations. Second, nonattitudinal processes are often ignored in explanations of D-score variance. Performance on any task is not process-pure; it is the joint product of several processes, and the D-score alone cannot tell you which ones produced it. But there are tools that offer a solution. Below we discuss one.
Introducing the Quad model
The quad model is a multinomial processing tree (MPT) model: a formal theory about the processing pathways that lead to particular responses on the IAT. On any given trial of the IAT, several things might happen. An evaluative association might be activated or not. The correct answer might be detected or not. If the two point to different response options, their conflict must be resolved so that one wins out over the other.
These possibilities — call them psychological states — combine into a set of paths, each running from the stimulus to one of the two outcomes the task records: a correct response or an incorrect one. Take a trial where an activated association points toward the wrong key. A correct response can still come about three ways. The association was never activated, and the correct key was detected. Or it was activated, but was overcome in favor of the detected correct response. Or neither happened, and a response bias toward the key that happens to be correct on this trial was engaged. Each path has a probability, and the probability of responding correctly on that trial is their sum.
Run that for every trial type and you get a system of equations linking a handful of unknown process probabilities to something you can actually count: how often people were right and wrong on each kind of trial. Solve the system, and the counts you observe become estimates of the processes you don't observe.
The four parameters
- AC — Activation of associations. The probability that an evaluative association is triggered by the stimulus, such as elderly = bad. When it fires, it pushes the response toward the key that matches the association.
- D — Detection. The probability of correctly identifying the stimulus and recalling which key it belongs to on this block. This is the accuracy of the sorting task itself, independent of any evaluation.
- OB — Overcoming bias. The probability of overriding an activated association in favor of the correct response. OB only exists when there is a conflict to resolve, so it is conditional on both AC and D: the association has to have fired, and the correct answer has to have been detected, before there is anything to overcome.
- G — Guessing. A response bias toward one key, operating only when neither an association fired nor the correct response was detected.
The conditional relationships between these parameters matters. OB is only estimable on trials where AC and D pull in opposite directions, and G only comes into play when the first two fail to influence responses. That nesting is exactly what the tree diagram shows, and it is why the model can separate processes that a single score folds together. Additionally, the psychological interpretation of these parameters is not assumed. Each has been validated against independent evidence.
Work through the model
The tool below lets you build the equations yourself. Because it is the most familiar case, the tool works through the Race IAT (Black/White, good/bad). The same structure applies to any evaluative IAT. Pick a trial type and the diagram highlights the paths available on that trial, with the corresponding equations beside it. Two things are worth watching for as you move through the eight trial types: which trials have an OB branch at all (only the ones where the association and the correct answer conflict), and how the trials that lack one become diagnostic of detection and guessing instead.
Trial Type
White + good share a response key
White + bad share a response key
White target — White + good share a response key
Response category 1 · White-good / Black-bad specification · no OB step
Assumes White targets are evaluated positively and Black targets negatively. AC estimates activation of the White-good and Black-bad associations; OB estimates control over those associations.
The activated association points at the correct key here, so this trial is compatible under this specification. With no conflict to resolve, it is diagnostic mainly of D — detection and G — guessing.
The equations above write ACwg as a single term. That is the algebraic collapse of ACwg × D and ACwg × (1 − D): on this trial type detection does not change the response, so D factors out. The diagram shows both branches, converging on the same outcome.
The model has to assume a direction: which group is being evaluated positively and which negatively. Toggle between the two specifications above to see how the same eight trial types map onto different underlying processes depending on which assumption is made. That assumption turns out to be far more useful than it first appears, as we’ll see in the next section.
An example of the Quad model's impact: understanding the absence of ingroup preference
Both ambiguities above are live questions in one of the more striking findings in the study of intergroup behavior.
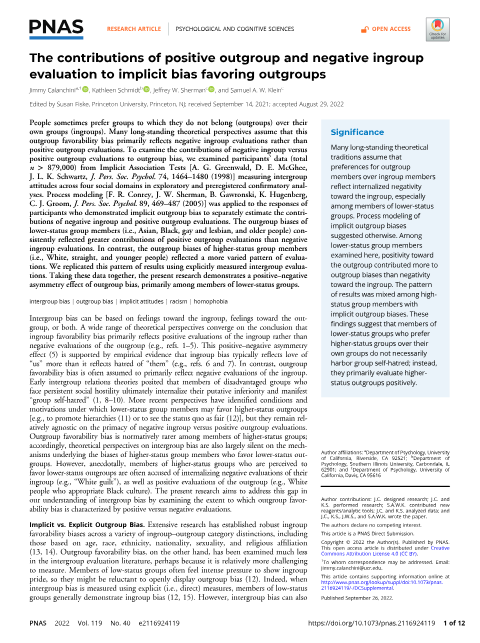
Ingroup preference is among the most reliably documented phenomenon in the psychological sciences. People favor their own groups in cooperation, in trust, in helping, in memory, in moral judgment — even when group membership is assigned arbitrarily. And yet for some, it is relatively absent. Beginning with Kenneth and Mamie Clark's doll studies in the 1940s, and repeatedly since, members of lower-status groups have shown attenuated ingroup preference, and sometimes outright preference for the higher-status outgroup. The pattern appears far more consistently on implicit methods like the IAT.
The standard explanation is internalization: members of lower-status groups are thought to absorb the negative stereotypes their society propagates about their ingroup. It is a plausible account, and for decades it went largely untested at the process-level, because a D-score cannot test it.
First question: what is the preference made of?
If an implicit outgroup preference reflects internalized ingroup negativity, then negative evaluations of the ingroup should be doing most of the work. If instead it reflects positive evaluations of the higher-status outgroup, that is a different psychological story altogether.
Splitting the AC parameter separately for positive-outgroup and negative-ingroup evaluation makes the two accounts separable. I joined my colleagues in doing just that, this across four social domains and over 800,000 online respondents showing implicit outgroup preference.
Outgroup bias consistently reflected positive outgroup evaluations more than negative ingroup evaluations. Higher-status groups showed no such consistency. Ingroup negativity was present, it was simply not the dominant ingredient. Preferring the higher-status outgroup, is not the same thing as disliking your own group.
Second question: is it only about associations?
Decomposing the associations still leaves the second ambiguity open. Everything above concerns what people have learned. But an absence of ingroup preference could also mean that ingroup-affirming evaluations are present and actively unexpressed.
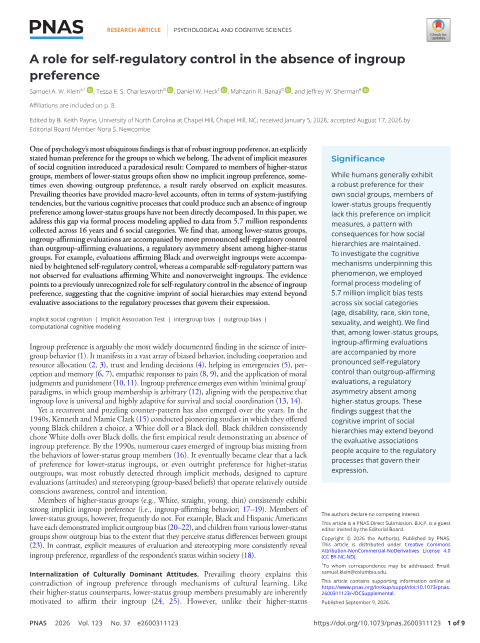
To tackle this question, my colleagues and I relied on two specifications of the quad model, as seen in the tool above. We fit each respondent's IAT data to a version of the quad model that assumed the evaluative associations were ingroup-affirming (i.e., positive evaluations of the ingroup, negative evaluations of the outgroup), and again to a version that assumed the evaluative associations were outgroup-affirming (i.e., negative evaluations of the ingroup, positive evaluations of the outgroup). The OB parameters in these models therefore assume the overcoming of ingroup-affirming and outgroup-affirming evaluations, respectively.
We fit both specifications to each of 5.7 million respondents' data, across sixteen years and six attitude domains, keeping whichever one fit better for each person, then compared OB across the two.
Among lower-status respondents, ingroup-affirming evaluations were overcome more often than outgroup-affirming ones in five of six domains, and often by a wide margin. Among higher-status respondents, no consistent direction emerged at all.
And it appears even in domains where lower-status respondents still show ingroup preference on average, only attenuated, meaning the associations alone do not account for the phenomenon.
The general point
Two findings, one phenomenon, and neither one visible in a D-score. The first says the absence of ingroup preference is less about ingroup negativity than the field assumed. The second says it is not only about evaluations at all, but also about the regulatory processes governing their expression. Understanding how social hierarchies persist may require looking past the content of our biases to the machinery that governs whether they are expressed.
Apply the quad model yourself
If you'd like to figure out how to implement the quad model for your own data, I suggest you start by walking through the template I've put together. If you click the button below, you'll be taken to an OSF page with template code, sample data, and the standard quad model equations file. The template code is commented to walk you through the analysis for a 2-group between-participants estimation and analysis of quad model parameters.
I haven't added the model specification comparison to the template yet, so please see my recent papers (and their respective OSF pages) for insights on implementing that procedure.
Contact me with any questions that cannot be answered with the material I've put together already. I hope this has been helpful!
References